Benchmarking Matter
On Windows, use a reasonably short project path. The harness rejects planned capture paths that exceed its Windows-compatible budget; see path-length troubleshooting.
Matter includes a deterministic benchmark harness that depends on Unity, the Matter runtime, and the Matter URP renderer. Import the Benchmark Suite sample before using the menu commands and batch entry points in this guide.
The benchmark has two complementary fixtures. Use the small fixture to judge rendering and topology by eye, and the full fixture to compare performance and memory behavior on a representative maximum-size world.
Simulation backend comparison
The backend comparison is a separate deterministic matrix for the compute and Burst implementations. It covers:
256x128,512x256,1024x512, and the full2048x1024stress size- saturated and sparse-localized worlds
- simulation-only CPU state and CPU state with the GPU presentation mirror
- alternating GPU/CPU execution order
- exact initial/final checksums, per-tick time, ticks per second, tracked native
and GPU memory, managed allocation, presentation upload bytes/time, and a
state-preserving live switch at
1024x512
GPU batches are synchronized by one final readback rather than a readback every tick. CPU presentation upload time is reported separately from simulation time. Every matched GPU/CPU case must produce the same final checksum; a parity mismatch is a correctness failure, not a performance warning.
Open Tools > Matter > Benchmarks, choose Backend Comparison, and run the quick comparison. The release matrix and CPU worker scaling are available through the command-line entry points below.
The Quick profile runs one repetition with shorter batches. Release runs four
repetitions. Results are written below
Artifacts/MatterBenchmarks/BackendComparison/<timestamp> as
backend-comparison.json, backend-comparison.csv, and summary.md; a failed
run writes failure.txt.
The CPU thread-scaling fixture runs simulation-only GPU reference cases plus
CPU requests 1, 2, 4, 8, and 0 (unlimited) for both workloads at all
four resolutions. It records both requested and effective worker counts and
requires every CPU result to match the GPU checksum. Its artifacts are written
to Artifacts/MatterBenchmarks/CpuThreadScaling/<timestamp> as
cpu-thread-scaling.json, cpu-thread-scaling.csv, and summary.md.
The CPU backend is a compatibility/headless fallback. The Feature Showcase
allows CPU Burst at every grid preset through 4096x2048, but the largest
presets are stress/inspection modes and are not implied to be real-time.
2048x1024 remains the largest controlled backend-comparison size.
Batch entry points:
& '<Unity.exe>' -batchmode `
  -projectPath '<Project>' `
  -executeMethod 'MasterTech.Matter.Benchmarks.MatterBackendBenchmarkHarness.RunQuickFromCommandLine' `
  -logFile 'Logs\MatterBackendQuick.log'
Use RunReleaseFromCommandLine for the release profile. Run comparative
performance captures only after background compiles, sync clients, and other
material CPU/GPU workloads are idle, and keep all environment variables
constant between baselines.
Use
MatterBackendBenchmarkHarness.RunCpuThreadScalingQuickFromCommandLine for a
batch-mode CPU scaling capture.
Feature Showcase painting stress
Import the Feature Showcase sample, then run
MasterTech.Matter.Samples.FeatureShowcase.Editor.MatterFeatureShowcasePaintStressBenchmarkHarness.RunFromCommandLine to measure a
maximum-size Landscape Painter drag against the Standard GPU model. This
fixture intentionally excludes Burst and rendering. For both a small brush and
the Showcase maximum brush it compares:
- the Standard simulation and ordered edit path alone;
- the same path through Showcase terrain-mask maintenance with no rigid bodies;
- the same path with one coalesced 2D/3D terrain-collider rebuild after stroke release.
The report records p50/p95/p99 stroke and sample times, queued edits, managed
allocation, exact final-state parity, collider rebuild count, region/path/point
counts, and separate timings for region extraction, 2D path writes, 3D mesh
writes, and collider activation. Results are written below
Artifacts/MatterBenchmarks/ShowcasePaint/<timestamp>-standard-gpu as JSON,
CSV, Markdown, and an environment manifest.
The collider case is a release-hitch diagnostic, not a simulation throughput claim. Compare its stages before changing the fluid solver: Unity physics collider activation can dominate even when ordered painting and Standard GPU ticks remain fast. Results are machine-specific and must always be compared with the Standard case from the same run.
Test matrix
Every run covers the Cartesian product below:
| Surface preset | Off | Multi-label marching squares | Topology-locked distance field |
|---|---|---|---|
| Low | Yes | Yes | Yes |
| Medium | Yes | Yes | Yes |
| High | Yes | Yes | Yes |
This produces nine cases. Stress-case order is deterministically shuffled for each repetition so that thermal and editor drift do not always favor the same preset or smoothing mode. Record the seed with every baseline. Low, Medium, and High are reproducible groups of independent surface settings, not shader quality modes; custom configurations can be benchmarked by assigning explicit settings before a run.
Visual inspection fixture
- Simulation:
160x90cells - Capture:
1600x900pixels - Deterministic world: caves, a four-connected one-cell bridge, an enclosed one-cell hole, diagonal-only contacts, isolated material cells, material junctions, suspended liquid, a contained pool, and gas
- States: seeded plus a topology-stability capture, with 512 simulation ticks as the default upper bound
- Stability policy: beginning halfway through the tick budget, sample the live GPU cell topology every four ticks; call it settled only after three consecutive samples change no more than 0.05 percent of visual cell keys (material plus quantized fill)
- Condensed-phase diagnostic: terrain and liquid settlement is also reported independently and requires zero condensed cells to change for three consecutive samples. This distinguishes a settled material/liquid fixture from intentionally dispersing gas without mislabeling the whole world.
- Truthful naming: a stable result is named
Settled<N>Ticks; a world that is still moving at the limit is namedAfter<N>Ticksand recorded asVisualAfterSimulation - Detail views: cave silhouette, thin terrain, and material/liquid junction
- Feature-rich output: 45 PNG files (nine cases times two overviews and three evolved-state details)
- Authored-texture output: 5 PNG files under
visual/authoredwhen the sample database has a valid baked render library (one High-preset/topology-locked seeded overview, one evolved-state overview, and three evolved-state detail views) - Flat-topology output: 15 PNG files (three smoothing modes with the Medium preset, with seeded/evolved-state overviews and phase-relevant detail views)
- Total output: 65 PNG files with a valid authored library, or 60 when the authored capture is unavailable
The runner rejects black or shader-error-magenta captures. It also rejects a
visual run if any two PNG hashes are identical, because every preset,
smoothing, state, and detail variant is intended to remain visibly distinct.
The settled flat-topology material/liquid junction is additionally profiled in
pixel space. A topology-locked shoreline that rises above its bulk waterline
or jumps between adjacent pixel columns by more than the resolution-scaled
antialiasing allowance fails the run, catching terminal domes and staircase
shelves while allowing smooth sub-cell curvature.
The nine-case comparison matrix uses deterministic procedural maps so presets
remain comparable. The dedicated visual/authored pass temporarily
binds the database's baked render library and proves the actual sample textures.
The flat-topology pass uses authored material colors with white ambient light
and disables texture maps, surface normals, height bias, organic displacement,
AO, shadows, highlights, rim light, and texture relief. This separates contour
behavior from art-direction lighting.
Inspect at least these comparisons:
Low_OffversusHigh_TopologyLockedDistanceFieldfor stair-stepping, preserved holes, thin terrain, and material boundaries.- Seeded versus the measured evolved state for deterministic fluid movement;
check whether the filename says
SettledorAfterbefore treating it as a static result. - All three smoothing modes at the cave and thin-terrain detail views for topology loss, bridges, isolated pixels, or halos.
- Material/liquid junctions for opaque/transparent ordering and edge color.
visual/topologybefore interpreting a dark halo or liquid-contact notch as a contour defect; if it disappears in the flat pass, it is a presentation cue.visual/authoredto verify the package's real sand, rock, liquid, and gas textures independently of the controlled benchmark maps.
Full stress fixture
- Simulation:
2048x1024cells - Render target:
2048x1024pixels - Known minimum GPU allocations represented by the cell, terrain-field, and lighting-field buffers: 88 MiB, before render targets, surface textures, driver resources, and Unity overhead
- Health output: one downsampled
512x256PNG per case and repetition
Two deterministic workloads are available:
- Saturated: the original world-wide terrain, liquid, and gas stress case.
- SparseLocalized: a compact active region surrounded by empty chunks. Use this to measure dirty-region and active-chunk optimizations without weakening the saturated regression gate.
Each case is measured in two phases:
- Render only: static simulation, including the normal distance-field update cadence where applicable.
- Full system: one deterministic simulation tick per rendered frame, with terrain and lighting-field updates at their configured cadence.
The run ends with an overload phase using the High preset, topology-locked distance fields, and four simulation ticks per frame. This is a saturation probe, not a normal frame-budget target.
| Profile | Repetitions | Render warmup / measured | Full-system warmup / measured | Overload |
|---|---|---|---|---|
| Quick | 1 | 30 / 120 frames | 30 / 120 ticks | 30 frames |
| Release | 3 | 60 / 300 frames | 120 / 600 ticks | 120 frames |
Use Quick while iterating. Use Release on stable clocks, the intended graphics API, and a release-candidate package. Do not compare results across different Unity versions, graphics APIs, resolutions, power modes, or hardware as if they were regressions.
Metrics and artifacts
Every run creates a timestamped directory below
Artifacts/MatterBenchmarks unless an output path is supplied.
environment.json: Unity, OS, CPU, GPU, graphics API, dimensions, every execution count, workload, field cadences, seed, deterministic initial-cell checksum, and aggregate package source hashframes.csv: per-frame wall, CPU, render-thread, GPU, allocation, draw-call, batch, SetPass, memory, tick, and distance-field-update valuescases.csv: per-case p50, p95, and p99 summaries, valid timing counts, and steady versus distance-field-update GPU medianscaptures.csv: capture kind, dimensions, health ratios, shoreline-profile measurements, SHA-256, and relative PNG pathscaptures.sha256: standard SHA-256 manifest for direct PNG comparisonsources.csv: per-file hashes for package C#, shader, compute, HLSL, assembly, and JSON sourcessummary.md: compact human-readable case tablefailure.txt: exception and stack trace when a run is rejected
Frame-timing values can be unavailable on some editor/graphics-API
combinations. Check valid_cpu and valid_gpu before comparing percentiles;
wall time remains available. Benchmark bookkeeping is preallocated and case
labels are prepared outside measured frames so the harness does not deliberately
add managed allocations to each sample.
For a hardware-specific regression gate, compare the median result across the three Release repetitions. A useful starting policy is to flag a case only when its p95 grows by both 15 percent and 0.5 ms, then confirm the regression with a second run. Keep correctness gates (successful completion, capture counts, capture health, and deterministic checksum) absolute.
Running from the Editor
After importing Benchmark Suite, open Tools > Matter > Benchmarks. The sample-local launcher starts with Quick Stress and also offers Release Stress, Visual Inspection and Backend Comparison. Review prerequisites and use Open Report Folder when a run completes. Backend Comparison is synchronous; interrupted rendering runs remain visibly failed/interrupted.
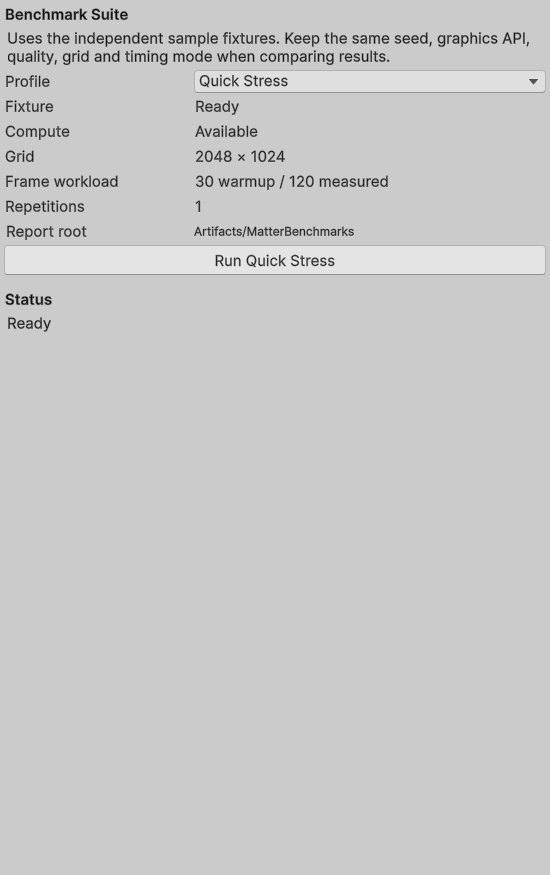
Choose Visual Inspection, Quick Stress, or Release Stress in the launcher.
The harness opens the imported Benchmark Suite scene, enters Play Mode, writes the artifacts, exits Play Mode, and restores the previously open scene.
Running in batch mode
Do not pass Unity's -quit option. The asynchronous harness exits Unity itself
after Play Mode and uses a non-zero process exit code on failure.
-matterBenchmarkSettledTicks is the stability-search upper bound; it no
longer asserts that every world is settled merely because that many ticks ran.
& '<Unity.exe>' -batchmode `
  -projectPath '<Project>' `
  -executeMethod 'MasterTech.Matter.Benchmarks.Editor.MatterBenchmarkHarness.RunVisualFromCommandLine' `
  -matterBenchmarkOutput 'Artifacts\MatterBenchmarks' `
  -matterBenchmarkSettledTicks 512 `
  -matterBenchmarkSeed 1337 `
  -logFile 'Logs\MatterVisual.log'
& '<Unity.exe>' -batchmode `
  -projectPath '<Project>' `
  -executeMethod 'MasterTech.Matter.Benchmarks.Editor.MatterBenchmarkHarness.RunStressQuickFromCommandLine' `
  -matterBenchmarkOutput 'Artifacts\MatterBenchmarks' `
  -matterBenchmarkSeed 1337 `
  -logFile 'Logs\MatterStressQuick.log'
Use RunStressReleaseFromCommandLine for the release profile. The quick and
release entry points also accept these optional integer overrides:
-matterBenchmarkWarmup-matterBenchmarkMeasured-matterBenchmarkFullWarmup-matterBenchmarkFullMeasured-matterBenchmarkOverloadFrames-matterBenchmarkRepetitions-matterBenchmarkWorkload Saturated-matterBenchmarkWorkload SparseLocalized-matterBenchmarkFusedDirtyMarking true|false
For a fast full-resolution wiring smoke test, use values 1, 2, 1, 2,
1, and 1 respectively. This still allocates and renders the complete
2048x1024 world, but it is not a stable performance baseline.
Standalone GPU-timing path
Editor batch mode can return zero valid GPU samples on otherwise supported graphics APIs. Build the package-owned standalone benchmark player when this happens. The build temporarily enables Unity's Frame Timing Stats player setting and restores the project's previous value afterward:
& '<Unity.exe>' -batchmode `
  -projectPath '<Project>' `
  -executeMethod 'MasterTech.Matter.Benchmarks.Editor.MatterBenchmarkHarness.BuildStandalonePlayerFromCommandLine' `
  -matterBenchmarkPlayerOutput 'Artifacts\MatterBenchmarkPlayer\MatterBenchmark.exe' `
  -logFile 'Logs\MatterBenchmarkPlayerBuild.log'
Launch the resulting executable with the opt-in player flag. It exits with a non-zero code on benchmark failure:
& 'Artifacts\MatterBenchmarkPlayer\MatterBenchmark.exe' `
  -matterBenchmarkPlayer `
  -matterBenchmarkKind StressQuick `
  -matterBenchmarkOutput 'Artifacts\MatterBenchmarks' `
  -matterBenchmarkWorkload Saturated `
  -screen-fullscreen 0 `
  -screen-width 2048 `
  -screen-height 1024 `
  -logFile 'Logs\MatterBenchmarkPlayer.log'
For an additional GPU-completion diagnostic, add
-matterBenchmarkCompleteGpuFrames to the standalone command. Each warmup and
measured frame waits for a one-pixel readback from the rendered target. This
prevents an offscreen command queue from moving one sample's GPU work into
later wall-time samples. Unsupported readback formats and readback exceptions
fail the run; also inspect the Player log for graphics-device or readback errors
before qualifying its results.
Require gpu_completed_frames=1 for every measured sample and
frameCompletionMode=SynchronousOnePixelReadback in environment.json.
Use the identical harness and completion mode in both compared players.
Synchronized wall times include CPU submission, GPU completion, and readback
overhead. Keep them separate from ordinary RenderSubmission throughput runs,
which retain their existing behavior and record gpu_completed_frames=0.
Neither wall-time mode is a GPU timestamp measurement.
GPU timestamps remain platform, driver, and graphics-API dependent even when
Frame Timing Stats is enabled. Confirm frameTimingFeatureEnabled,
gpuTimerFrequency, and valid_gpu in the artifacts. If GPU samples remain
unavailable, use paired CPU/wall comparisons with render-only control cases and
confirm shader-level work in an external GPU profiler.